
HVAC, control and electrical diagrams in the same project as the floor plans
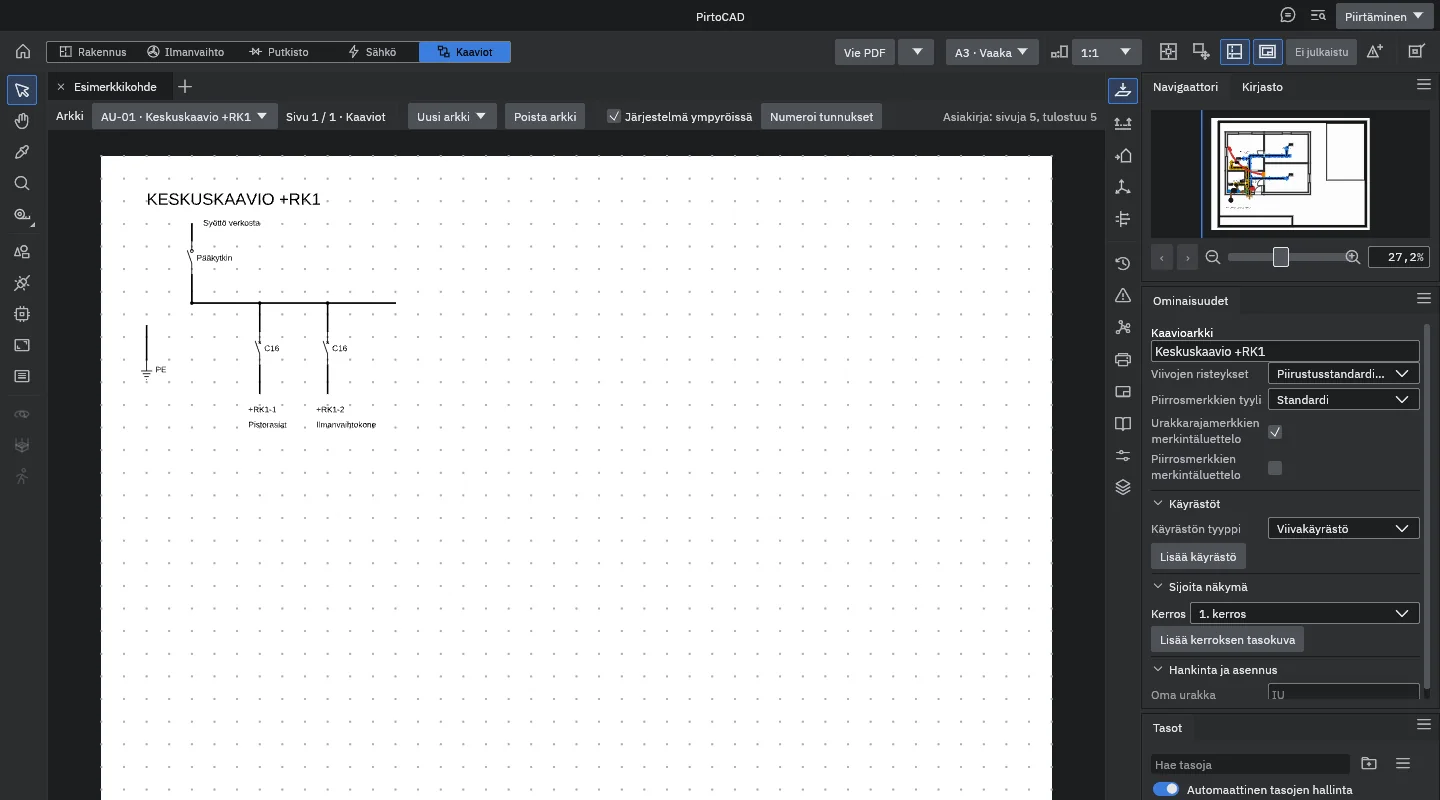
A diagram sheet with its grid, symbols in the RakMK D4 line widths, orthogonal connecting lines and controller I/O bars. The point list exports to Excel, and the diagram prints on its own page with a title block.
What you draw and assemble
Diagram sheet and symbols
Choose the Diagrams discipline and create a diagram sheet. Typing part of a symbol's name narrows the list of the Place symbol tool. Symbols and line bends snap to a 2.5 mm grid, and once the tag letters are set, every symbol you place takes the next free number.
- Pumps, valves, heat exchangers and expansion vessels
- Fans, dampers, filters, heating and cooling coils and heat recovery units
- Instruments and sensors, plus electrical switching and protective devices
From the electrical model you can generate a main distribution diagram, a board diagram and other electrical diagrams on a new diagram sheet. More on the Electrical page.
Connecting lines that follow the ports
The Connect tool draws a primary, process, duct or signal line from port to port at right angles. When you move a symbol, a line ending on it follows the port and is rerouted. A signal line can carry a contract boundary mark, and the sheet then gets the contract legend.
Controller I/O bar and point list
The I/O bar has six bands: alarm, status (DI), measurement (AI), control (DO), modulation (AO) and auxiliary devices. Connect the points to symbols and export the point list to Excel from the menu of the Export PDF button: every point gets its own row, and each band gets a total.
Text, charts and output
Double-click a tag, a line text, a controller name or a point description to edit it in place. The function description is added with the Diagram text tool, and device outlines and delivery limits with the Boundaries tool. A chart, such as a heating curve or a pump's H-Q curve, is added from the Charts section of the diagram sheet's Properties panel, and you type the pump curve points yourself. The diagram is a page of its own with a title block. A storey plan can be placed beside it, and Export PDF prints the diagram at 1:1.
Symbols and lines with their sources
Every symbol records its standard and source, with page or record, and a status: VAHVISTETTU (verified) when the symbol has been checked against its source, VARMISTAMATTA (unverified) when it has not. Some symbols are still unverified.
| What | Source | Where it is used |
|---|---|---|
| Piping, ventilation and control symbols | RakMK D4 LVI-piirrosmerkit 1978 (Finnish HVAC drawing symbols); some follow Talotekniikka 2 and the forms Finnish design offices draw | Place symbol list |
| Electrical symbols | Records of the IEC 60617 database | Place symbol list |
| Instrument bubbles for measurement and control | The practice of Finnish HVAC design offices, checked against real control schematics | Instrument bubble and diagram tags |
| Line widths 1.0, 0.7, 0.5, 0.35 and 0.25 mm | RakMK D4 | Symbols, connecting lines and PDF |
The designer is responsible for the diagram. Symbols and tags help, but a diagram is only as good as its input data. An empty Problems panel means that the program's current checks found nothing. It does not mean that the diagram has been checked.
Coming to diagrams
These are in progress and not yet in the alpha:
- Clicking and dragging a chart on the canvas
- Keeping manual line bends when a symbol is moved
- A check for charts overlapping the title block
- Solid chart fills and arrowheads in DXF export
The diagrams path
The planned path is the foundations course first, then the diagrams course, which goes from a first diagram sheet to an air handling unit control schematic. No episodes have been published yet.
 Video coming